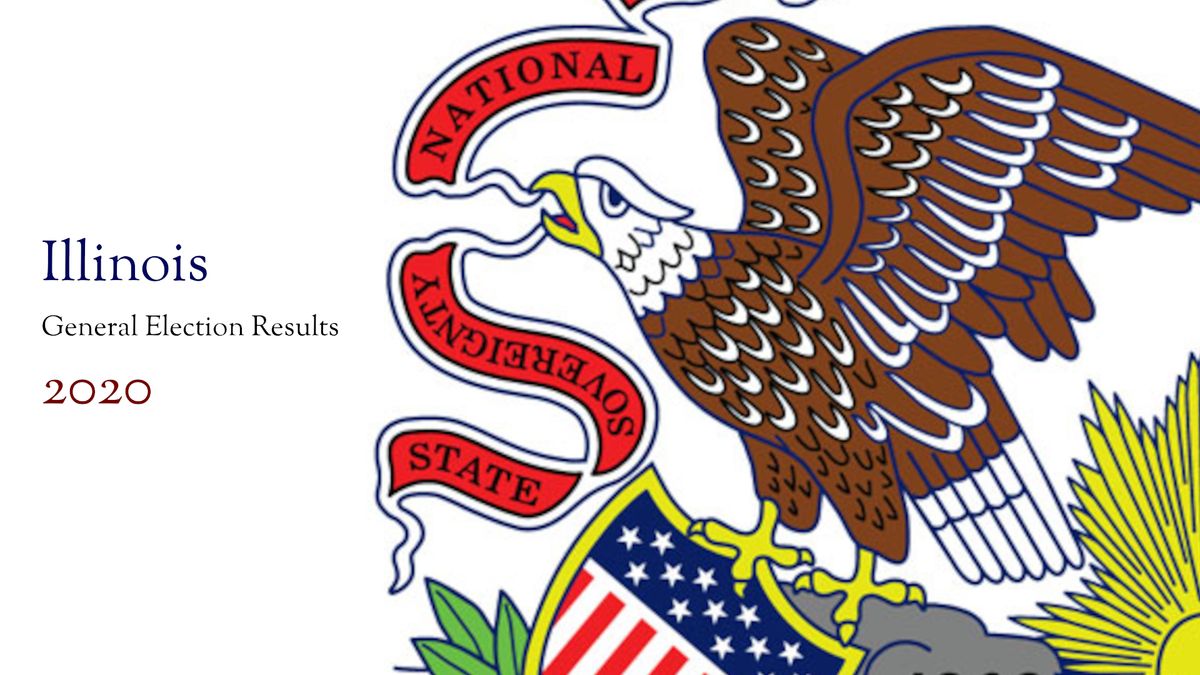
Illinois Politics
Illinois General Election Results - 2020
The official results from Illinois voters in the 2020 general election from the Illinois State Board of Elections.
National Elections Results
President of the United States
| Candidate |
Party |
Total Votes |
Percent of Vote |
| Joseph R. Biden Jr. |
Democrat |
3,471,915 |
57.54% |
| Donald J. Trump |
Republican |
2,446,891 |
40.55% |
| Jo Jorgensen |
Libertarian |
66,544 |
1.10% |
| Howie Hawkins |
Green |
30,494 |
0.51% |
U.S. Senate
| Candidate |
Party |
Total Votes |
Percent of Vote |
| Richard J. Durbin |
Democrat |
3,278,930 |
54.93% |
| Mark C. Curran Jr. |
Republican |
2,319,870 |
38.87% |
| Willie Wilson |
Independent |
237,699 |
3.98% |
| Danny Malouf |
Libertarian |
75,673 |
1.27% |
| David F. Black |
Green |
56,711 |
0.95% |
U.S. House District 1
| Candidate |
Party |
Total Votes |
Percent of Vote |
| Bobby Rush |
Democrat |
239,943 |
73.80% |
| Philanise White |
Republican |
85,027 |
26.15% |
U.S. House District 2
| Candidate |
Party |
Total Votes |
Percent of Vote |
| Robin Kelly |
Democrat |
234,896 |
78.81% |
| Theresa J. Raborn |
Republican |
63,142 |
21.19% |
U.S. House District 3
| Candidate |
Party |
Total Votes |
Percent of Vote |
| Marie Newman |
Democrat |
172,997 |
56.38% |
| Mike Fricilone |
Republican |
133,851 |
43.62% |
U.S. House District 4
| Candidate |
Party |
Total Votes |
Percent of Vote |
| Jesús "Chuy" García |
Democrat |
187,219 |
84.05% |
| Jesus Solorio |
Republican |
35,518 |
15.95% |
U.S. House District 5
| Candidate |
Party |
Total Votes |
Percent of Vote |
| Mike Quigley |
Democrat |
255,661 |
70.77% |
| Tommy Hanson |
Republican |
96,200 |
26.63% |
| Thomas J. Wilda |
Green |
9,408 |
2.60% |
U.S. House District 6
| Candidate |
Party |
Total Votes |
Percent of Vote |
| Sean Casten |
Democrat |
213,777 |
52.82% |
| Jeanne Ives |
Republican |
183,891 |
45.43% |
| Bill Redpath |
Libertarian |
7,079 |
1.75% |
U.S. House District 7
| Candidate |
Party |
Total Votes |
Percent of Vote |
| Danny K. Davis |
Democrat |
249,383 |
80.41% |
| Craig Cameron |
Republican |
41,390 |
13.35% |
| Tracy Jennings |
Independent |
19,355 |
6.24% |
U.S. House District 8
| Candidate |
Party |
Total Votes |
Percent of Vote |
| Raja Krishnamoorthi |
Democrat |
186,251 |
73.16% |
| Preston Gabriel Nelson |
Libertarian |
68,327 |
26.84% |
U.S. House District 9
| Candidate |
Party |
Total Votes |
Percent of Vote |
| Janice D. Schakowsky |
Democrat |
262,045 |
70.98% |
| Sargis Sangari |
Republican |
107,125 |
29.02% |
U.S. House District 10
| Candidate |
Party |
Total Votes |
Percent of Vote |
| Brad Schneider |
Democrat |
202,402 |
63.87% |
| Valerie Ramirez Mukherjee |
Republican |
114,442 |
36.12% |
U.S. House District 11
| Candidate |
Party |
Total Votes |
Percent of Vote |
| Bill Foster |
Democrat |
194,557 |
63.30% |
| Rick Laib |
Republican |
112,807 |
36.70% |
U.S. House District 12
| Candidate |
Party |
Total Votes |
Percent of Vote |
| Mike Bost |
Republican |
194,839 |
60.43% |
| Raymond C. Lenzi |
Democrat |
127,577 |
39.57% |
U.S. House District 13
| Candidate |
Party |
Total Votes |
Percent of Vote |
| Rodney Davis |
Republican |
181,373 |
54.46% |
| Betsy Dirksen Londrigan |
Democrat |
151,648 |
45.54% |
U.S. House District 14
| Candidate |
Party |
Total Votes |
Percent of Vote |
| Lauren Underwood |
Democrat |
203,209 |
50.67% |
| Jim Oberweis |
Republican |
197,835 |
49.33% |
U.S. House District 15
| Candidate |
Party |
Total Votes |
Percent of Vote |
| Mary Miller |
Republican |
244,947 |
73.45% |
| Erika C. Weaver |
Democrat |
88,559 |
26.55% |
U.S. House District 16
| Candidate |
Party |
Total Votes |
Percent of Vote |
| Adam Kinzinger |
Republican |
218,839 |
64.71% |
| Dani Brzozowski |
Democrat |
119,313 |
35.28% |
U.S. House District 17
| Candidate |
Party |
Total Votes |
Percent of Vote |
| Cheri Bustos |
Democrat |
156,011 |
52.02% |
| Esther Joy King |
Republican |
143,863 |
47.97% |
U.S. House District 18
| Candidate |
Party |
Total Votes |
Percent of Vote |
| Darin LaHood |
Republican |
261,840 |
70.41% |
| George Petrilli |
Democrat |
110,039 |
29.59% |
State Elections Results
Required 60% Approval to Pass
|Yes or No|Total Votes|Percent of Vote|
|---|---|---|---|
|No|2,753,526|55.1%|
|Yes|2,243,840|44.9%|
Illinois Supreme Court - 5th District
| Candidate |
Party |
Total Votes |
Percent of Vote |
| David Overstreet |
Republican |
362,666 |
62.9% |
| Judy Cates |
Democrat |
213,632 |
37.1% |
Illinois Supreme Court - 3rd District Retention, Judge Kilbride
Required 60% Approval to Pass
|Yes or No|Total Votes|Percent of Vote|
|---|---|---|---|
|No|339,329|43.6%|
|Yes|438,833|56.4%|
Cook County Elections Results
Cook County State's Attorney
| Candidate |
Party |
Total Votes |
Percent of Vote |
| Kim Foxx |
Democrat |
895,586 |
53.7% |
| Patrick W. 'Pat' O’Brien |
Republican |
662,640 |
39.7% |
| Brian Dennehy |
Libertarian |
109,638 |
6.6% |
Full Illinois election results for 2020 are available here: